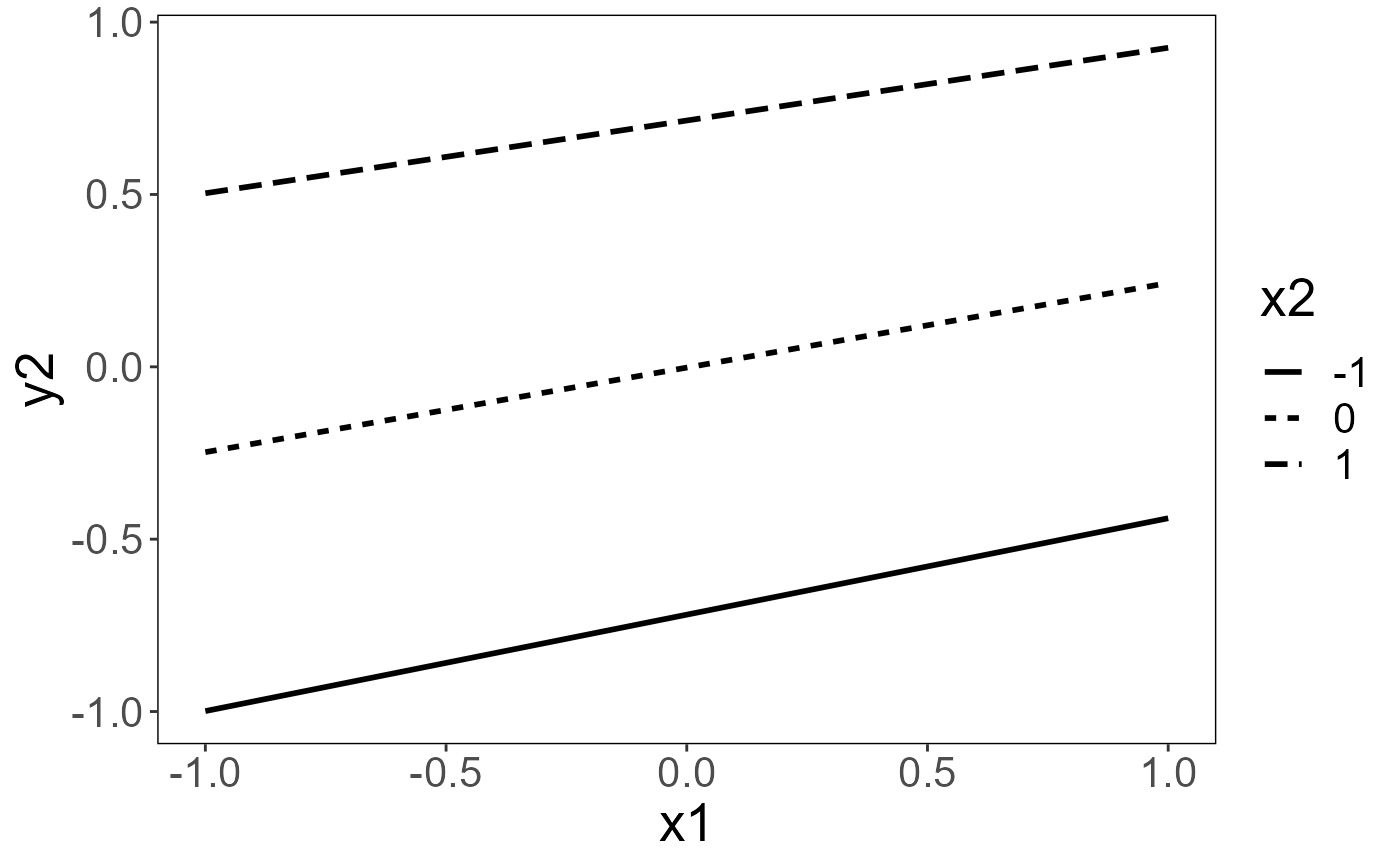
This function generates an interaction plot from a lavaan model with a 2-way (x*w) interaction.
Arguments
- model
lavaan object
- x
(character) variable name to plot on the x axis
- w
(character) variable name to plot on separate lines (moderator)
- y
(character) variable name indicating the outcome
- values_at
(named list) values at which to plot
xandw(default -1, 0, and 1 for both)
Details
The predicted values are calculated using lavaan::lavPredictY() for the
variable given in y, and observed variables are extracted from the
model object using lavaan::lavNames(). All other variables are assumed
to be 0, so the y-axis on the plot will only be meaningful if all
observed variables were centered prior to entering the model.